Project information sharing can make or break a project. On one hand, digital solutions have allowed project documentation to reach levels of detail and context never before seen. On the other hand, that bulk of information without documentation standardization can leave it useless, as project stakeholders don’t know where and when to be able to access the latest documentation they need when they need it.
Dashboards to the rescue
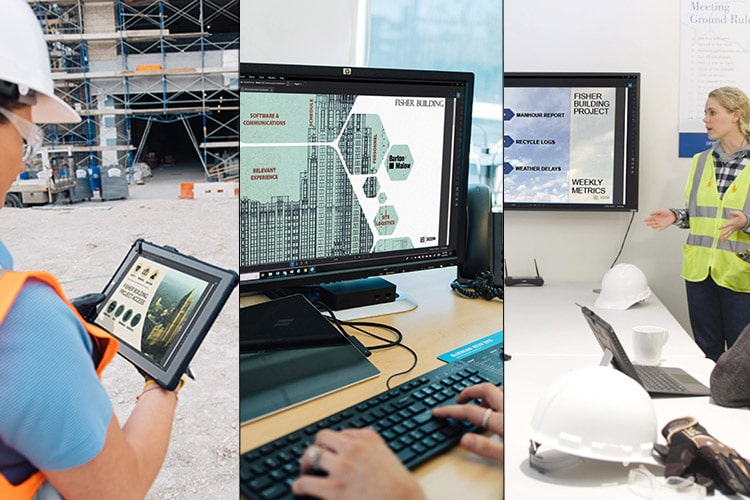
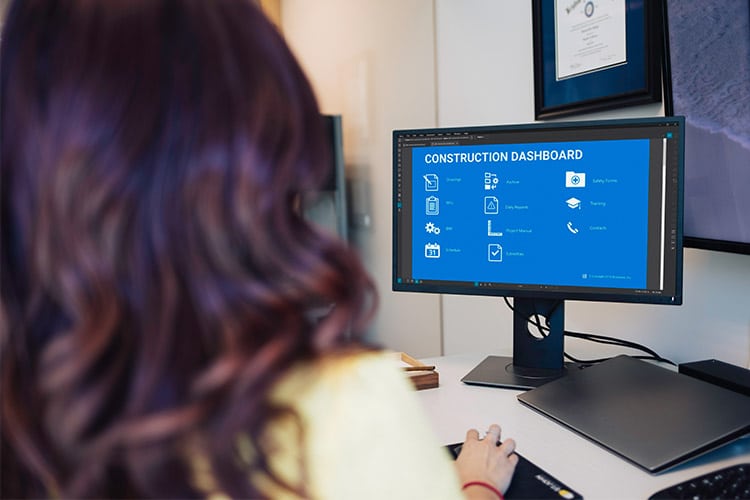
One solution that has the industry abuzz is the concept of digital dashboards, a project intranet with folder locations and links to allow for easier access of project information within industry-familiar formats like PDF and DWG files. These dashboards act as a map to help end users find and access the relevant project documents for their various roles on project teams. Using dashboards can offer a new power to teams trying to assess data within the drawings—especially when access to a 3D model for data can be limited or nonexistent for some project stakeholders.
Hoffman Project Estimator Luke Brown has seen the dashboard concept become useful for his project teams and began to wonder if there were even more efficiencies to be gained through creating them. “Dashboards allow owners and the tradespeople who are building to quickly be able to get information, rather than trying to hunt and peck to find a file. You can establish a location and dump something into a folder, they can point and click for access,” notes Brown.
“In the construction industry in general, pretty much everybody’s using Bluebeam for the majority of their document control when it comes to PDF documents,” explains Brown. After producing document packages for a weekly deliverable on an IPD project, Brown wondered if there was more that could be done as part of the total value design process or “TVD.” “When we were finally ready to release the issued-for-construction documents package, I had a conversation with the trade partners about how they would like to navigate the documents,” says Brown. I said, ‘Hey, I’ve built your typical hyperlinks, but is there anything else that you’d like to have?’ And they said, ‘Well, we’d like to be able to jump from here to any other document with a click of a button.’ At the time that seemed like a reach, but it was something I wanted to be able to accomplish.”
The next level of dashboard creation
Brown not only created a navigable dashboard, he took the concept to an even more detailed level by making all of his construction project documents accessible via batch hyperlinking and using some of the other Bluebeam tools, but in a different way than most users. For instance, by batch processing headers and footers to apply Bates numbering to unrelated documents he was able to leverage batch hyperlinking to quickly create links between documents that otherwise wouldn’t have any relationship. He began linking up an entire construction project, including close-out materials, warranty materials, and O&M manuals for a turnover package to produce a final deliverable within a fully hyperlinked package. “What might’ve normally had taken three or four weeks to get all linked together by hand, we can do it in probably 20 to 30 hours for all of the documentation that goes into there,” says Brown. Traditionally, this type of dashboard would be a multi-phase document comprised of several sheets, but by using some JavaScript attached to form buttons, Brown was able to create a more efficient and detailed navigation—with model information contained within the drawings.
“Typical dashboards are hyperlinked sets of documents that you have to eventually go back to an index sheet, or home dashboard to use,” he explains. “Instead, we’ve got a toolbar along the side that says, ‘Hey, I know I want to go look at my electrical stuff.’ I can go click on the electrical button and open up the dialog box, which lets me go grab the appropriate electrical plan from my RCP (reflected ceiling plan) for a completely different floor.”
If you need to have access to your 3D PDF within the same floor plan, all you need is Bluebeam Revu Places, two hyperlinks and a little bit of creativity.
Brown created Places, which are really small spaces with a hyperlink. “I then add a UDF (Universal Disk Format) file to create the 3D PDF in that very small location, and a hyperlink back to the full sheet view.” This allows the end user to have two different areas of viewing. “The first hyperlinks take you to the Place (3D PDF), then the other takes you back to the full-sized sheets. While it looks like you’ve jumped between 2D and 3D—you’re actually still on the same document. It’s an ideal situation for something like a P&ID,” he elaborates. “And then I can hand this over to anybody, and say, ‘Okay, if you want to see the model, click on the room type, or specific location.’ You click on the room tag. There it is. Look inside the model and hold and spin. And when you’re done with it, click back to go back to your planning view. It’s just that simple.”
The payoff
Brown no longer has to train anyone on how to drive a model or have them get lost within the programs to find location information. Aside from making his project partners’ search for data or information easier, Brown has some hard dollar value associated with his dashboard concept:
“It took me eight hours to build navigational bars, and then I went out and looked at how long people were taking to navigate through an iPad, and it was roughly 10 seconds per link,” explains Brown. “If it took me eight hours to build navigational bars, and it saves 10 seconds per click; and I’ve got 25 craft workers making 30 clicks per day, that’s a total of two hours out of a day. That equals 10 hours a week, and 40 hours a month, which leaves 500 hours per year of wasted time. If you burden labor at $75 an hour, the savings is $40,000. And this is a final deliverable that we just basically hold over to the owner.”
Finding simple solutions to complex problems is Brown’s constant motive for jobsite innovation, and the ease of creation and use of his dashboard has been its greatest benefit. “The complexity of it is really not that difficult, so it can be done by anybody. You don’t have to be some sort of coding guru or anything along those lines. Don’t get me wrong—I love models. The information that’s contained inside of those things can be infinite, if you know how to access it, and you know how to use it. But the PDF still is the king at the end of the day, for now.”